Last updated 2026-07-10
TL;DR
If nearby homes with similar size, age, and features are assessed lower than yours, that gap is evidence of non-uniform assessment, one of the strongest grounds for a property tax appeal. Pull your neighbors' assessments from public records, calculate a simple ratio, and present the disparity at your hearing. Boards must reduce your assessment to achieve uniformity in most states.
What does it mean to use neighboring assessments as evidence?
Property tax appeals rest on two separate legal theories. The first is overvaluation: your home is worth less than the assessor says. The second is non-uniformity (sometimes called inequity): your home is assessed at a higher percentage of market value than comparable nearby properties, even if the dollar figure looks defensible on its own.
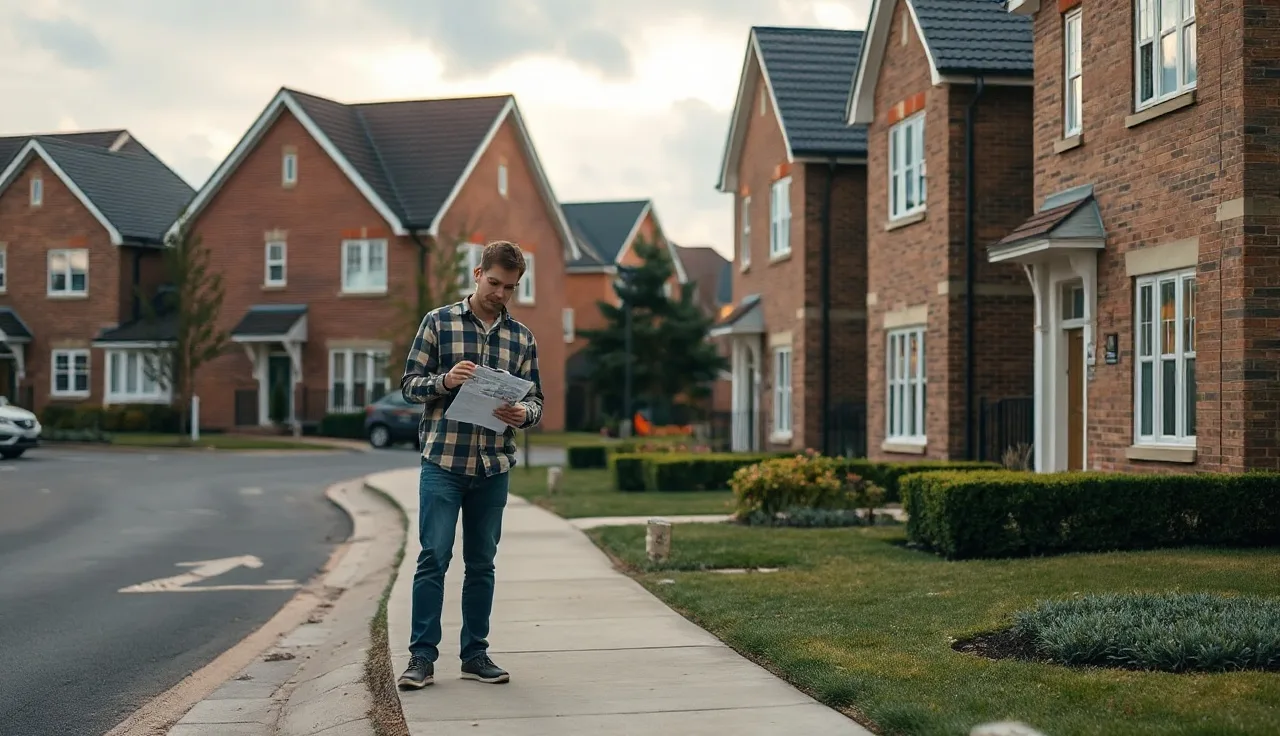
Using your neighbors' assessments as evidence targets that second theory. You are not arguing about what your house would sell for. You are arguing that the assessor applied a different standard to your parcel than to parcels that are legally supposed to be treated the same way. Most state constitutions require uniform taxation of property [1]. When your assessment ratio is higher than your neighbors', that constitutional requirement is being violated.
This matters because it is often easier to win on uniformity than on value. Sales comps require you to find truly comparable recent sales, argue condition adjustments, and fight over price per square foot. Uniformity comps just require public records that already exist in the assessor's own database. You are using the assessor's own numbers against them.
Where do you find your neighbors' assessment data?
Every county assessor keeps a public database of assessed values. In most places you can search it online for free. Look up your county assessor's website and hunt for terms like "property search," "parcel inquiry," or "real estate database."
A few reliable starting points:
- Your county assessor's official website (search "[county name] assessor parcel search").
- State-level GIS portals, which many states now maintain.
- Third-party aggregators such as Zillow, Redfin, or Realtor.com display assessed values pulled from public records, though they may lag by a few months.
For specific county lookup tools, see the individual county guides for places like Cook County, Gwinnett County, Bexar County, and Montgomery County.
Once you find a neighbor's parcel, write down: the assessed value, the square footage listed by the assessor, the year built, the lot size, and the number of bedrooms and bathrooms. You need those fields to calculate a valid comparison [2].
Do not skip this step. Boards reject comparison evidence all the time because the homeowner grabbed a neighboring number without confirming the properties have similar physical characteristics. A 1,400-square-foot ranch and a 2,600-square-foot two-story are not comparable no matter how close they sit.
How many comparable parcels do you need to build a strong case?
Three is the floor. Five to ten is where you want to be. Boards want a pattern, not a single outlier.
Start with properties within a quarter mile. Prioritize homes on the same block or in the same subdivision because assessors generally use neighborhood boundaries to cluster properties, so those parcels ran through the same mass-appraisal model as yours [11]. If your neighborhood has fewer than 10 single-family homes, you can expand the search radius, but note the expansion in your submission and explain why you had to do it.
Target properties that share at least these features with yours:
- Within 15 to 20 percent of your home's gross living area.
- Same general construction type (frame, brick, etc.).
- Comparable age, within roughly 10 to 15 years.
- Similar lot size.
- No dramatic condition differences (a fire-damaged house or a recently gut-renovated house is not a fair comp).
You can pull 5 to 10 solid comps in a couple of hours on most county assessor websites. It is not glamorous. It is spreadsheet work. But it is the kind of evidence that wins.
How do you calculate the assessment ratio and show the disparity?
The assessment ratio is the assessed value divided by the market value (usually the most recent sale price, if available). The formula is:
Assessment Ratio = Assessed Value / Sale Price
Example: Your home is assessed at $380,000. It sold 18 months ago for $400,000. Your ratio is 0.95, or 95 percent.
Now run the same calculation for each neighbor who sold in the last one to three years. If their ratios cluster around 80 percent, you have a clear uniformity argument: you are being assessed at 95 percent of market while the neighborhood average is 80 percent.
What if your neighbors have not sold recently? Then use the assessor's estimated value (often listed as "market value" or "appraised value" in the public record, separate from the taxable assessed value) as the denominator. This is a weaker comparison because you are dividing by the assessor's own estimate rather than an arms-length sale, but it still shows internal inconsistency in the assessor's own model [4].
The table below shows a simple uniformity analysis using hypothetical but structurally realistic numbers, so you can see the format you would build in your own spreadsheet.
| Parcel | Sq Ft | Assessor Market Value | Assessed Value | Ratio |
|---|---|---|---|---|
| Your home | 1,650 | $400,000 | $380,000 | 95.0% |
| Neighbor A | 1,720 | $395,000 | $310,000 | 78.5% |
| Neighbor B | 1,580 | $385,000 | $305,000 | 79.2% |
| Neighbor C | 1,700 | $410,000 | $322,000 | 78.5% |
| Neighbor D | 1,600 | $390,000 | $308,000 | 79.0% |
| Neighborhood median | 78.8% |
At hearing, your ask is simple: reduce my assessment to $315,000, which is 78.8 percent of market value, consistent with every comparable parcel in the same neighborhood.
Many boards respond well to this framing because you are asking them to apply their own standard more consistently. You are not asking for a special deal.
What legal standard requires the assessor to treat your property uniformly?
The Fourteenth Amendment's Equal Protection Clause sets a federal floor: states cannot systematically assess one class of property at a higher ratio than another [1]. But for residential appeals, the more useful standard usually comes from state law.
Almost every state has a constitutional or statutory uniformity clause. Illinois property tax law, for instance, requires that assessments be uniform within assessment districts [5]. Tennessee's Comptroller of the Treasury publishes annual sales ratio studies for exactly this reason: to track whether counties hit their legally required assessment level [6].
In practice, the standard you invoke at a hearing is whatever your state's appeal board statute says. Most boards are authorized to reduce an assessment to the "common level" of assessment in the jurisdiction, defined as the median assessment ratio derived from arms-length sales. The IAAO (International Association of Assessing Officers) recommends a coefficient of dispersion (COD) below 15 percent for residential property as a benchmark of acceptable uniformity [3]. A COD above that threshold signals that properties are being treated unevenly, which strengthens your case even further.
One concrete quote worth carrying into your hearing: the IAAO's Standard on Ratio Studies states, "The primary purpose of the ratio study is to measure assessment level and uniformity" [3]. That is the standard your assessor is supposed to meet. When your ratio is measurably different from your neighbors', the standard has not been met for your parcel.
How do you present neighboring assessments at a hearing?
Format matters more than most homeowners expect. Boards hear dozens of appeals in a single day. A clean one-page summary beats a stack of printouts every time.
Here is the structure that works:
1. A cover page with your name, parcel number, address, the current assessment, and the reduced assessment you are requesting. 2. A one-page table showing your property alongside four to eight comps, with the columns shown in the ratio analysis section above. 3. Printouts from the county assessor's website for each comparable parcel. These prove you did not make the numbers up. 4. A one-paragraph narrative explaining that the comparables are physically similar, located in the same neighborhood, and assessed at a median ratio of X percent while your ratio is Y percent.
Keep the whole packet under 10 pages. Board members will read every page of a 10-page packet and skim or ignore a 40-page one.
When you speak, lead with your conclusion. Do not build up to it. Say: "My home is assessed at 95 percent of market value. The four comparable parcels on this block average 79 percent. I am asking you to reduce my assessment to $315,000 to bring it in line with those properties." Then stop and let them ask questions.
If you want a structured system for building this packet, the TaxFightBack DIY Appeal Kit walks through the exact documents to pull, how to format the comparison table, and what to say at each stage of the hearing.
A few things not to do: do not argue the assessor is a bad person, do not bring in news articles about the housing market, and do not speculate about what your house would sell for unless you have an actual sales comp. Uniformity evidence is strongest when it is purely numerical.
What if comparable homes were recently renovated or have extra features?
This is the adjustment problem. A neighbor's 1,650-square-foot house might be assessed lower than yours for legitimate reasons: they have a carport and you have a three-car garage; their kitchen is original and yours was just remodeled; they have no basement and you have a finished one. The assessor will raise all of these points.
You have two options. First, choose comps where these differences are minimal. A good comp has no obvious features that explain the assessment gap. Second, where differences exist, adjust for them. The assessor's own records often contain cost-per-feature breakdowns (a finished basement is valued at X dollars per square foot, a fireplace adds Y dollars, etc.) because those are the factors built into the mass-appraisal model. You can request these schedules from the assessor's office, or they are sometimes published in the county's assessment manual.
If after adjustment your ratio is still higher, the disparity holds. If adjustment closes the gap, drop that comp and find a better one. Do not try to paper over a weak comp with a footnote. Boards notice.
For markets with very high assessed values, like LA County or Santa Clara, the adjustment amounts can be large and the stakes of getting them right are correspondingly high.
Does this approach work for newly purchased homes?
It depends on your state and the timing of your purchase. In most states, a recent sale is treated as evidence of market value, and if your sale price is lower than your assessed value, overvaluation is actually the easier argument to make. But some states, notably California under Proposition 13, reassess only at sale and hold long-term owners' assessments at historical levels. In those states, comparing your post-sale assessment to a long-term neighbor's is misleading because the lower assessments reflect the constitutional design, not an assessor error [7].
In states with annual or triennial reassessments, a recent purchase does not disqualify you from a uniformity argument. Your purchase price simply becomes your market value anchor, and you compare assessment ratios for neighbors who sold in the same general period.
If you recently bought in a high-property-tax market like NYC, the valuation and uniformity dynamics are even more complex, because NYC uses a fractional assessment system with separate classes for one-to-three-family homes versus larger properties. Check your state's specific rules before building a uniformity case.
What common mistakes get uniformity evidence thrown out?
The board is not required to accept your comparables. Here are the mistakes that get them rejected most often.
Using properties that are not actually similar. A 900-square-foot condo compared to a 2,200-square-foot single-family detached home is not a uniformity argument. It is noise.
Using stale assessed values. If your county had a reassessment between when you pulled your comps and when you appear at the hearing, the old figures are irrelevant. Always pull fresh data within a few weeks of your hearing date.
Failing to cite the source. Print the assessor's web page or attach the parcel inquiry result. "I looked it up online" is not evidence. A printout with the assessor's URL and a retrieval date is.
Including exempt properties. Government-owned, nonprofit, or agricultural parcels are assessed under different rules. If you accidentally include one, the assessor will use it to discredit your entire table.
Mixing assessment years. If your county assesses on a staggered cycle, some neighbors may be on a different year's value. Note the assessment year for each comp in your table.
Asking for too much. If you ask for a reduction to 50 percent of market value when the neighborhood median is 79 percent, you signal that you are guessing. Ask for the median ratio. Nothing more, nothing less.
How does this strategy work alongside sales comps (market value evidence)?
Uniformity evidence and sales comps are not mutually exclusive. You can and often should present both.
The practical sequence: lead with uniformity if your assessment ratio is clearly above the neighborhood median, because it does not require you to defend a specific value opinion and is harder for the assessor to rebut without conceding that other parcels are treated differently. Follow with sales comps if they also support a lower value, as a second independent basis for relief.
Boards generally have the authority to grant the larger of the two reductions, or they may blend the analyses. Some states require the board to use the uniformity standard as the primary basis, with value evidence as secondary. Check your state's appeal statute or board procedures.
A caution: do not let a strong uniformity case make you lazy about value evidence. Sometimes the whole neighborhood is over-assessed. In that case the uniformity argument does nothing for you, and you need a sales comp case to get any relief at all. Both approaches together give you the best odds. For high-value markets like Hennepin County, combining both types of evidence is especially worth the extra effort.
What are realistic outcomes when you use neighboring assessment evidence?
Nobody has perfectly clean national data on appeal success rates broken down by evidence type. The closest honest source is the Lincoln Institute of Land Policy, which found that roughly 25 to 30 percent of residential property tax appeals result in a reduction [8]. Practitioners report, anecdotally, that uniformity arguments produce smaller reductions than aggressive value arguments but close more often, because the math is hard for the assessor to dispute.
For residential property, average assessment reductions in successful appeals typically run between 5 and 20 percent, according to various state and county appeals board reports, though the range is wide depending on how far off the original assessment was [9].
The cost of this approach, if you do it yourself, is your time: roughly two to four hours to pull comps, build the table, and prepare your hearing packet. You keep 100 percent of any tax savings rather than paying the 25 to 40 percent contingency fee that most professional appeal firms charge [10].
Here is the math that should motivate you. A 10 percent reduction on a $400,000 assessment in a jurisdiction with a 2 percent effective rate saves you $800 a year, every year, until the next reassessment. A contingency firm at 33 percent would pocket $264 of that first-year savings, and the work involved is the exact spreadsheet analysis described in this article.
Frequently asked questions
Can I use online estimated values from Zillow as neighboring assessment comps?
No. Zillow's Zestimate is an automated valuation model, not a public assessment record. Boards require official assessor records. Zillow does display assessed values pulled from county databases, which are fine to reference if you confirm the number directly on the assessor's website. Always print from the official source and note the URL and date.
How recent do comparable sales need to be for a uniformity analysis?
For the denominator in your ratio calculation, use sales within 24 months of your assessment date. Sales within 12 months are stronger. If you are using the assessor's estimated market value instead of a sale price, recency matters less because both you and the neighbor are on the same assessment cycle. Note the sale date for every comp in your table.
What if my neighborhood has very few comparable sales?
Expand your radius to the nearest subdivision or census tract with similar housing stock, and explain in your submission why you had to go further. You can also rely on the assessor's internal market value estimates rather than sale prices, which does not require recent transactions. In rural areas, three solid comps within a reasonable radius are often enough.
Is uniformity evidence accepted in every state?
Almost universally yes, because uniform assessment is a constitutional requirement in most states. California is a notable exception for owner-occupied residential property: Proposition 13 ties assessments to purchase price, so long-term neighbors' lower assessments reflect the law, not an error. Check your state's appeal statute before building a uniformity argument.
Do I need an appraiser to present neighboring assessment evidence?
No. Neighboring assessment data is public record, and you can present it yourself as a pro se appellant. An appraiser is worth hiring for a formal sales comp analysis or a high-value commercial appeal, but for residential uniformity evidence the data gathering and presentation is well within reach for any homeowner willing to spend a few hours on the county assessor's website.
What is a coefficient of dispersion and should I mention it at my hearing?
The coefficient of dispersion (COD) measures how spread out assessment ratios are across a neighborhood. The IAAO standard for acceptable residential uniformity is a COD below 15 percent. You do not need to calculate it yourself, but if your county publishes a sales ratio study showing a high COD, cite it. It shifts the burden: the assessor's own data shows systemic unevenness.
Can I request the assessor's internal property record cards to check my neighbors' features?
Yes. Property record cards (sometimes called field cards or property data sheets) are public records in most states. Submit a public records request to the assessor's office. They show the exact square footage, room count, construction quality grade, and condition rating the assessor used, which lets you adjust for feature differences between your home and your comps.
How do I handle it if the assessor disputes my comparable choices at the hearing?
Expect it. Prepare a one-sentence justification for each comp: address, square footage, year built, and why it is comparable. If the assessor rejects a comp with a legitimate reason (different zone, major renovation, etc.), concede gracefully and point to the remaining comps. Even two or three solid uncontested comps showing a 10-plus point ratio gap usually support a reduction.
What happens if I win my appeal based on uniformity but my assessment is still too high?
You can appeal again in the next assessment cycle. A uniformity-based reduction brings you to the median ratio, not necessarily to full market value. If you believe there is an independent overvaluation argument, raise it in the same hearing as a second basis for relief. Getting both arguments heard at once is more efficient than filing separate appeals.
Does using my neighbors' assessment data violate their privacy?
No. Assessed values and property characteristics are public records by design in every U.S. jurisdiction. The assessor's database is open to anyone. You are not accessing private financial information; you are reading government records that are legally required to be available for exactly this kind of taxpayer review.
How far in advance of my hearing should I pull the comparable data?
Pull data no more than two to three weeks before your hearing date and print or save PDF copies with the retrieval date visible. Assessors update records continuously, and a board will not accept data you pulled six months ago if the records have since changed. Fresh printouts also demonstrate you did the work properly.
Can I use this strategy for commercial property appeals?
Yes, but uniformity arguments are harder to execute for commercial property because each parcel tends to be more unique, making true comparability difficult to establish. Income-based valuation usually dominates commercial appeals. That said, if you own a small commercial property in a dense area with many similar buildings, assessment ratio comparisons can still be meaningful supplemental evidence.
Sources
- U.S. Constitution, Fourteenth Amendment; Cornell Legal Information Institute: Equal Protection Clause requires states to treat similarly situated properties uniformly for taxation purposes.
- International Association of Assessing Officers (IAAO), Standard on Mass Appraisal: Assessment comparables must share similar physical characteristics including size, age, construction type, and location.
- IAAO, Standard on Ratio Studies (2013 edition): The IAAO states: 'The primary purpose of the ratio study is to measure assessment level and uniformity.' Residential COD should be below 15 percent.
- Lincoln Institute of Land Policy, Significant Features of the Property Tax: Assessment ratio studies using assessor estimated values as denominator are an accepted method for uniformity analysis when sales data is sparse.
- Illinois Department of Revenue, Property Tax Overview: Illinois property tax code requires assessments to be uniform within assessment districts.
- Tennessee Comptroller of the Treasury, Division of Property Assessments, Sales Ratio Studies: Tennessee publishes annual sales ratio studies to monitor whether counties meet legally required assessment levels.
- California State Board of Equalization, Proposition 13 Overview: Under Proposition 13, California reassesses residential property only upon sale, so neighbor comparisons based on long-term owners' lower assessments reflect the constitutional design, not error.
- Lincoln Institute of Land Policy, property tax appeal research: Roughly 25 to 30 percent of residential property tax appeals result in a reduction.
- Cook County Assessor's Office, Annual Report: Successful residential appeals typically result in assessment reductions in the range of 5 to 20 percent.
- National Taxpayers Union Foundation, Property Tax Appeal Guide: Professional property tax appeal firms typically charge contingency fees of 25 to 40 percent of first-year tax savings.
- IAAO, Assessment Administration: Assessors use mass-appraisal models clustering properties within neighborhood boundaries; parcels in the same cluster should be assessed under the same model.